Boat monitoring system
Introduction
In 2019 I installed a new battery monitoring system and solar panels on Sundog using Victron devices. These devices provide excellent information about the state of the charge, voltage levels, current consumption, solar input but the problem is that I can only see this information when I am at the boat. Since we don’t live-aboard (yet) I wanted to be able to see how the system is performing and if there was a problem what alarm conditions might occur. So during the fall of 2019 I started to research what I could do for collecting and sending data from the boat to me where-ever I might be.
The initial plan
I started off with working on software to be able to collect data from the Victron devices. They publish their VE.direct data protocol which can be collected with the physical connection using their VE.direct USB cable. Unfortunately they do not publish their Bluetooth protocol as stated on their web-site because of the complexities for programming Bluetooth software and the worry about public supporting it. I can understand why but more about that later. I looked at writing the software to run on either an Arduino device or a Raspberry Pi device. I choose to work on the Raspberry Pi as I could purchase and run one of those devices and it would have the required USB ports and would be a more capable platform. The Arduino could run lower power consumption but does not have near the same level of operating system and software capabilities as the Raspberry Pi. After worked with QNX , Linux and other real-time operating systems I had become very used to being able to take advantage of C++, standard template libraries, etc.
The original BlueFin development
As I started work on the project the important first step, as anybody who works on a new high tech project knows, was to come up the project name… BlueFin. You might note that at BlueFin is a type of tuna fish and I was looking for something that might have a relationship to sailing, the oceans, water, etc.. And blue kind of fit with the Victron devices since their corporate color and used with the devices is a shade of blue.
So after having come up with the project name, I set out to writing software to parse the data stream coming from the Victron devices. I first captured some actual data coming from the BMV712 and MPPT devices to my laptop to confirm what I would get would match with the protocol documents I had downloaded. With this data and confirmation I started to write the software to parse the data stream to capture all the different data items that it would transmit. There are different parsers that already existed for doing some of this work but I choose to implement my own. I did this because it allowed me to exercise my programming skills and roll my own for what I wanted to do. I was able to write the software to gather the data, log to data files and email the gathered data to myself.
I was planning that when I wanted the data emailed that the boat would be at the marina where I could take advantage of the WiFi network for connectivity. If the email did not work, I could always connect to device and download the logged data later. Emailing of the data was built using the Curl library of functionality that provide me a simple way to use SMTP (Simple Mail Transfer Protocol) for the sending.
I then set out to have some simple data display. My initial plan for a display had been to use an e-Ink panel (same kind of display used on e-readers like a Kobo) connected to the Raspberry Pi. These provide low power and simple text/graphics. I had a working display system but ran into a limitation of the display that I purchased as I had not considered the drawing time. The display was slow to the point that I could not show information in real-time. Not a big deal if you are not at the boat to actually see something but in the future I thought I might want that. The e-Ink display I was using a Waveshare 2.7 inch three-color (white, black, and red) E-Ink display HAT (Hardware Attached on Top). That mean that the display is typically placed right the Raspberry Pi board. This was fine for my development but I anticipated later being able to extent out the display to have it accessible at the chart table while the main computer board would be hidden away elsewhere.
<insert picture(s) here>
The display HAT has four buttons so this provided me the capabilities for some simple interactions. I setup the software to have a simple push a button and it would display a ‘page’ of information. I setup a page for each of the Victron devices I had and one for an overall system view of when data had last been received.
Adding sensor input to the system
With the basics of a system for the Victron devices I then started to consider what other data I could collect that might be of interest. I had a few years back purchased an Arduino board and a temperature/pressure sensor to learn about Arduino and to learn what I could do for environment data gathering. That project never had gone anywhere and seeing as I had the parts sitting there I thought the Arduino would be a good way to look at getting the data. Yes, something new to learn!
Using the sample code it was relatively easy to get the Arduino and sensor wired up and capturing data on that board. I then used a physical Ethernet Arduino shield (yes, I do love how every different platform has a different name for their additional hardware additions) to connect between the Arduino and the Raspberry Pi. As I had built up a fair bit of infrastructure of software for the Victron devices I was quickly able to add the additional view of the sensor data to the system I had.
Although I was able to quickly get this up and running I realized the problems with this as I would have:
- Yet another device to power
- I would need to make a ‘production’ system out of the bread-board wired up board and sensor
So I paused work on this while I went on to evolving the display system for the main Raspberry Pi.
BlueFin display evolution
I considered what I would want to do for a different display for the Raspberry Pi by doing some research as to what was available from various suppliers. Ideally I was looking for either a better e-Ink display that would have the same ability to do colours, be a reasonable size to view different data, and have input capabilities. I did not really find what I was wanted and was drawn to looking at what I might have to do to combine a display with other input buttons for a custom interface. Some benefits would be to keep power consumption down and being able to layout exactly what I wanted. The drawbacks of course being that I then started looking at what it would take to actually make a production version that I could put on the boat. I looked for some commercially available cases and what a custom designed case might be. I then thought what about just using an old phone or cheap small tablet as the display.
That sent me on a tangent of considering writing an application that could run on Android devices and wireless communicate with the unit for getting the data. Ugh, I had done lots of work in my prior job of writing software that would run as a service on an Android device but never done UI work on Android. I looked into it but I thought that might be big learning curve to try and do that. As I continued my investigations into what I could use to simply the development I ran across Node-RED.
This tool, originally development by IBM and in the public domain since 2016, could be used to develop not only the user interface but also provide a method to extend out the functionality of the boat monitoring system. The tool provides an editor to ‘wire’ together various functionality to handle the input of data, processing that data to filter/modify/perform additional calculations and to feed the data to various user inteface elements that can be displayed on a dashboard. The dashboard is accessible via a standard browser and hence would be instantly cross-platform capable for a variety of devices (Android, Windows, Apple, etc.).
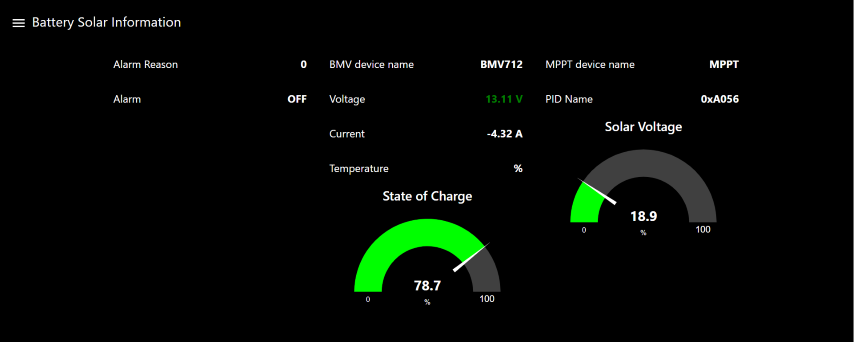
I installed Node-RED on my Raspberry Pi and was quickly able to learn the basics of using the tool. I setup various text and graphical elements for data that I might want to display. I then worked out how I wanted to feed the data from the software that I had already written to the Node-RED flows. As I had already put together functional to feed changing data from my parser to the display module, I figured I could easily do this. Node-RED has nodes you can use to easily put together the handling of HTTP data I choose to implement this method to send the data. I was already using CURL for emailing data and the library also provides a rich set of functionality for HTTP posting of data it was an obvious choice. I quickly built up the functionality for posting the data and I had the basics of a display system running.
I am still not sure if I will just use an old phone or some type of physical display on the boat. I really want to have a display as the phone is again, just becomes another thing to worry about keeping charged etc. I lucked out on finding a 7″ HDMI display that somebody was selling and so I have now been using that for my display. It’s nice as it gives a fair amount of display area but I worry it might be too big, so every so often I look at what I might do for a 4″ or 5″ display.
Evolving the sensor data collection
Since I was not liking at that point the Arduino prototype solution for sensor data gathering I started looking at what was available for sensors. I ran across a Texas Instrument device that had a number of sensors in a little package that ran off one of the coin cell CR2032 batteries. This device uses Bluetooth Low Energy (LE) communications for how you connect to the device. I thought that would be good solution and would have the extra benefit of being a learning experience with Bluetooth. I started shopping and searching the internet for the best / cheapest way to get one of these devices. I like a bargain so was not just going to buy one our right. Eventually I found a real deal as somebody was selling one locally on Kijiji.
I set out to learn about Bluetooth and how to communicate to the device. Rather than write everything from scratch which would be lot of work and not really what I wanted I had to find some free library that would provide base functionality for me to build upon. I found a library called “TinyB” that was a little old and did not seem to be actively maintained but I thought would serve my purpose. I downloaded the code and using the supplied sample I could connect the device. I then had to learn more about the details of discovering available devices, connecting to the device, determining the services it supported and how to gather the data from those services. I soon was able to collect data from the temperature, pressure and humidity sensors on the device. This data is then feed to the Node-RED in JSON format using the same design pattern as I had used for the Victron devices. Now with this little sensor tag I could get environmental information for the boat.
Adding NMEA data display
The next major work effort I undertook was to add the display of data from my boat instruments. The previous summer I had finally installed my boat electronics upgrades where I had added Garmin equipment (chart plotter, VHF and AIS) interconnected with NMEA 2000. I had not replaced my wind, speed and autopilot equipment which was older Raymarine ST60 devices. My chart plotter did not have access to the Raymarine data as it did have any means to interconnect with the SeaTalk 1 bus of the old instruments. I had looked at various solutions for being able to share data between the two different bus and protocol systems. I even considered trying to build my own solution. There is some information available on the internet but it seems to be all ‘reverse-engineered’ solutions as detailed documentation for the protocols is not in public domain. As well, in the winter months I don’t have access or a running systems to work with it would be pretty cost prohibitive to try and buy some hardware to be able to develop this at home. Plus I sure did not want to mess up something and cause problems with the installed systems in the boat. I finally decided to look more at commercially available devices that I could work with. The solution I decided to buy is a Yacht Devices NMEA-2000 Router (YDNR-02).
This device provides a bridging and WiFi solution to be able to interconnect all the marine instrument devices that I have. It has a NMEA 2000 connection, SeaTalk connections and even NMEA 0183 connections. I do not have any NMEA 0183 devices so it was the NMEA 2k to SeaTalk and WiFi connection that I would be able to leverage.
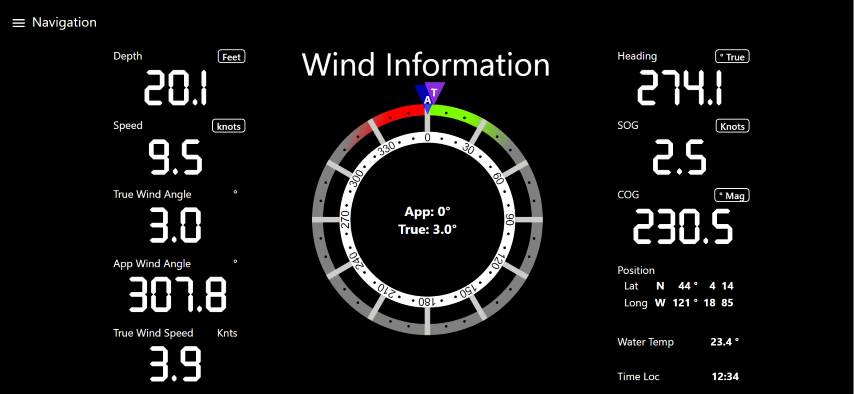
To be able to collect and display the data I started off gathering information about the various protocols and what I would need to be able to for decoding the information. Using this information I started to write a data stream parser for NMEA 0183. It being my understanding that the SeaTalk data would be sent out using that format. I developed the parser and wrote code for creating data objects that would understand the particular sentences that my RayMarine devices would be transmitting. This data was then published to Node-RED where I could display it. My initial goal was to basically create my own ‘data repeater’ display at the chart table below deck. I initially used the available display UI controls that the Node-RED dashboard provides to create my display.
I built up the ability to toggle display of data between magnetic and true for heading data. It was a learning experience but seemed ‘clunky’ in manner which I thought somewhat just not the elegant solution that I liked. I checked the available controls that other people have contributed to the public domain but nothing was available for what I wanted. As part of my work on other parts of the system I had done some work at setting up custom built UI controls so once again I created my own. There is basic information available on the internet for how to do this but I found it some what lacking. Eventually with hours of research, experimentation and debugging using browser developer tools I was able to create my own custom control for a ‘marine instrument’ that I could configure for the data items it would receive and to selectively display the data desired. I found this to be a more elegant contained solution as compared to what I was previously doing. I have now also created a custom control for display true and apparent wind information in a compass rose view.
System Overview
Below is a couple of pictures showing an overview of the system and a bit more about the software modules.

Overview of Sundog’s marine electronics

BlueFin software modules on the Raspberry Pi
Sample screen captures


Recent Comments